
Prometheus is a free and open source programming environment that permits us to gather measurements from our applications and stores them in an information base, particularly a period arrangement based DB. It is an incredible observing framework reasonable for dynamic conditions. Prometheus is written in Go and use inquiry language for information preparing. Prometheus gives measurements of CPU, memory, plate utilization, I/O, network insights, MySQL worker and Nginx.
In this post, We will install and configure Prometheus – Monitoring system & time series database on Ubuntu 18.04 LTS.
Step 1: Update the System
You need to update the ubuntu current repository server by using the given command.
sudo apt-get updateStep 2: Add Prometheus Repository
Once the ubuntu system up to date So then you need to add the prometheus repository by using the command.
wget https://s3-eu-west-1.amazonaws.com/deb.robustperception.io/41EFC99D.gpg | apt-key add -Step 3: Install Prometheus
You need to update the ubuntu repository and use the following command to install prometheus packages.
sudo apt-get update
sudo apt-get install prometheus prometheus-node-exporter prometheus-pushgateway prometheus-alertmanager -y
Here we are installing all the required package for the prometheus along with aletmanager, node-expoter and pushgateway.
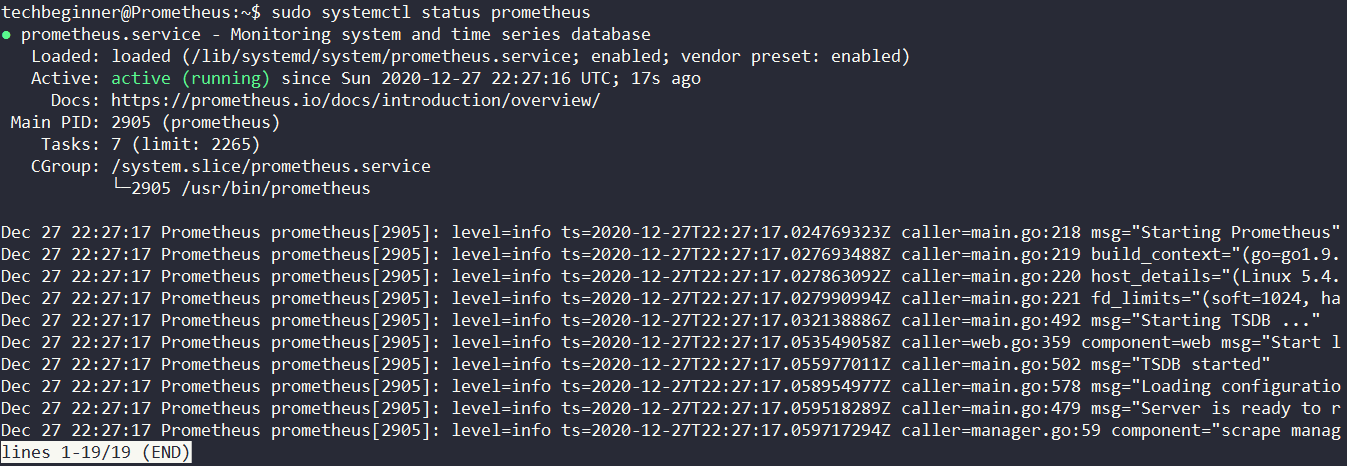
Get the prometheus service status by using the given command.
sudo systemctl status prometheus
Step 4: UFW Rules
After installation of the packages, We need to open the required port by using the command.
sudo ufw status
sudo ufw allow 9090
Step 5: Accessing Web Panel
You need to open the browser with http://localhost:9090 or http://IP_Address:9090 if everything okay, So then you should get web page like this.


Step 6: Download Grafana
cd /tmp
sudo wget https://dl.grafana.com/oss/release/grafana_5.4.3_amd64.deb
Step 8: Installing Dependencies
sudo apt-get install -y adduser libfontconfigStep 9: Installing Grafana
sudo dpkg -i grafana_5.4.3_amd64.debStep 10: Controlling Service
sudo systemctl status grafana-server
sudo systemctl enable grafana-serverTo start the grafana service execute the given command.
sudo systemctl start grafana-server
Step 11: UFW Rules for Grafana
Once you get the service So then you need to open the port 3000 in UFW or your firewall.
sudo ufw status
sudo ufw allow 3000
Step 12: Setup Grafana GUI Mode
Once you get the service So then you need to open the port 3000 in UFW or your firewall.
http://localhost:3000 Or http://IP_address:3000
Here you need to use he default username and password to login and reset the password.
Username – admin
Password – admin

Now you need to set the new password to login.

After that you need to click on Add data source button after that you need to click on prometheus data source, You should get the web page like this.

Select Data source prometheus.

Put the prometheus source http://localhost:3000


Step 13: Setup Grafana GUI Mode
Now you need to import the pre-define system metric dashboard by using the given id, Follow the given step.
Its time import predefine dashbard, click on Dashboard button after that you should get the import button click on it.
for basic system monitoring, I am using CPU Utilization Details (Cores) [ID: 7039] custom dashboard. Copy the dashboard ID from here.

When you click on load So then you need to select prometheus as a data source as well.

Now should get the pre-define grafana dashboard like this, Here you will the all the information about the basic system hardware utilization.

Conclusion
In this post, We have successfully installed prometheus, Still have any query please comment below.
Get connected with our new devops tools based website- https://www.devopstricks.in/
Great Aftab Sir
My pleasure.