In this post, We will install and configure Apache node exporter with prometheus on ubuntu.
I believe you have already installed and setup the Prometheus and Grafana if not so then use the given useful link for the same.
https://www.techbeginner.in/2020/12/how-to-install-prometheus-on-ubuntu.html
Welcome to our post for the most proficient method to Monitor Apache Web Server with Prometheus and Grafana in under 5 minutes. This arrangement should work for any form of Apache web worker running on any kind of Linux. We have other Prometheus Monitoring instructional exercises:
You need to update the ubuntu current repository by using the given command.
sudo apt-get updateHere you need to download the Apache2 node exporter by execute the given command step by step.
cd /tmp
curl -s https://api.github.com/repos/Lusitaniae/apache_exporter/releases/latest   | grep browser_download_url   | grep linux-amd64 | cut -d '"' -f 4 | wget -qi -
tar -xzvf apache_exporter-*.linux-amd64.tar.gz
sudo cp -ivr  apache_exporter-*.linux-amd64/apache_exporter /usr/local/bin
sudo chmod +x /usr/local/bin/apache_exporter
apache_exporter --version
Sample output.

You need to the system user and group by using the given command.
sudo groupadd --system prometheus
sudo useradd  -s /sbin/nologin --system -g prometheus prometheus
after that we need to create apache_exporter.service systemD file in /etc/systemd/system/ execute teh given command for the same.
sudo vim /etc/systemd/system/apache_exporter.servicePaste the following configuration.
[Unit]
Description=Prometheus
Documentation=https://github.com/Lusitaniae/apache_exporter
Wants=network-online.target
After=network-online.target

[Service]
Type=simple
User=prometheus
Group=prometheus
ExecReload=/bin/kill -HUP $MAINPID
ExecStart=/usr/local/bin/apache_exporter
  --insecure
  --scrape_uri=http://localhost/server-status/?auto
  --telemetry.address=0.0.0.0:9117
  --telemetry.endpoint=/metrics

SyslogIdentifier=apache_exporter
Restart=always

[Install]
WantedBy=multi-user.target
Save and exit from the vim text editor, and Restart the apache_expoter_service.
sudo systemctl daemon-reload
sudo systemctl start apache_exporter.service
sudo systemctl enable apache_exporter.serviceYou need to configure apache exporter in prometheus to recived the apahcer stats, Use the given command for the same.
sudo vim /etc/prometheus/prometheus.yml
and paste the following configuration like this.
# Apache Servers
  - job_name: apache-web-server
    static_configs:
      - targets: ['localhost:9117']
        labels:
          alias: server-apache
Save and exit from the editor.
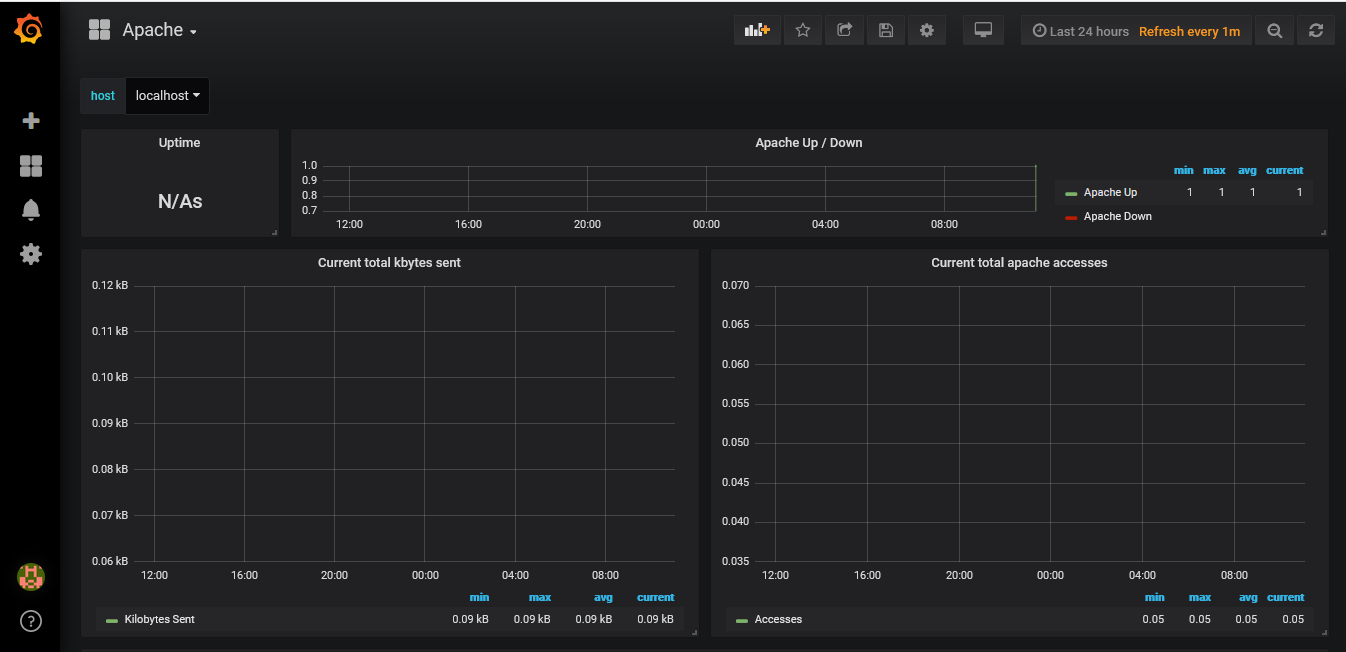
sudo systemctl restart prometheusNow we are ready to add the data source in prometheus and import the Apache web server predefined dashboard in Grafana, Use the 3894 ID for the same.

Conclusion
We have successfully configured Apache node exporter with prometheus, Still you are facing same issue then leave a comment with your problem to get better support.
Nice blog, it is very impressive.
JMeter Training Institute in Chennai
JMeter Online Course
Best JMeter Training Institute in Bangalore
There are actually a number of details like that to take into consideration. That is a great point to convey up. I offer the thoughts above as basic inspiration but clearly there are questions just like the one you carry up where crucial factor will likely be working in trustworthy good faith. I don?t know if best practices have emerged around issues like that, however I am certain that your job is clearly identified as a good game. Both boys and girls feel the affect of only a second抯 pleasure, for the remainder of their lives.
Please provide me with more details on the topic
Sure.